Role of Count and Variances in stats
- General
- Prof. Shankar MM
Role of Count and Variances in stats
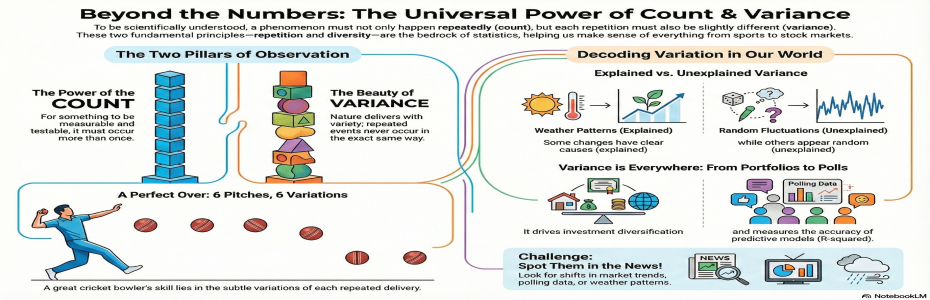
Why do "count and variance" play a crucial role in every repeated human endeavour? A business analyst, a data scientist, has a lot of flowers to choose from the garden of algorithms. Most say their favourite algorithm is supervised, unsupervised, or very specific, such as regression or principal component analysis. My favourite statistics are count and variance. A phenomenon comes from the social or life sciences; it must occur frequently to make it observable, measurable, and testable. Unlike the religious system, measurement science or statistics does not appreciate phenomena occurring only once, for instance, a Saint walking on water, a Great person measuring the whole earth in 3 steps of a foot, and examples never end. Science needs not only that phenomena be repeated, but that they not repeat in the same manner; at least an iota of difference in occurrence. Here, both the count and the variance come into play. Human civilisation is said to have learned to count from the 10 fingers or 12 phalanges in each finger, which may have been the first form of counting in the world. Whatever occurs repeatedly in this universe does not occur in the same manner; nature delivers with variety and diversity, which is another hallmark of statistics: variance. In a mid-1990s cricket match, I wonder how Waseem Akram can deliver six yorkers in an over, slightly with variations. Variations of delivery made him the best bowler during those days. Imagine each of these deliveries being measured and recorded, some slightly longer or shorter, faster or slower. Over time, patterns emerge, and some variations can be explained by factors such as the bowler's technique or the pitch condition. This is explained variance. Conversely, unexplained variance accounts for those spontaneous changes that can't be easily attributed to known factors. Pause and ask yourself: where have you seen variance in your own work? You can think of stock returns in a similar way. Some changes are explained by market trends or economic data, while others remain a mystery. So whatever a human does as a good performance needs to be repeated; it cannot be said to be a godly miracle only once, and it is delivered with a different flavour. Different flavours bring diversity, and in statistical terms, not skewed output. In common man's language, no extremes bring a balanced approach in all the walks of life. If it is a stock portfolio, advocate for diversified investment. Back to variance, there are two types: explained and unexplained variance. Fischer converted this into an F-ratio or ANOVA, which explains the ratio of explained to unexplained variance, a remarkable contribution to the experimental domain. The accuracy of any predictive model can be measured using R-squared, which indicates the proportion of variance in the outcome variable explained by the predictors in the model. Further dimension-reduction techniques are assessed by the total variance explained by the model. To truly grasp the everyday significance of the count and variance, I challenge you to spot them in tomorrow's news headlines. Whether it's variations in market trends, shifts in political polling, or changes in weather patterns, identifying these statistics at work will turn your understanding into active engagement.
It is simple statistics; it is a common man's subject, rather than something to be embraced only by the business analyst or data scientist. It is as simple as tasting sugarless chai, but unfortunately, our students are bamboozled by the jargon rather than its simple meanings and by the applications. I hope you will become a fan of the count and variance of your every endeavour.